Smart Fertigation Systems: Cost Analysis, ROI & Savings Explained
Target keyword: smart fertigation systems
Short Excerpt
This guide explains how smart fertigation systems influence total cost of ownership (CAPEX + OPEX), where the savings typically come from (fertilizer, water/energy, labor, yield stability), and how to estimate payback using a simple ROI model.
I. Introduction & Background

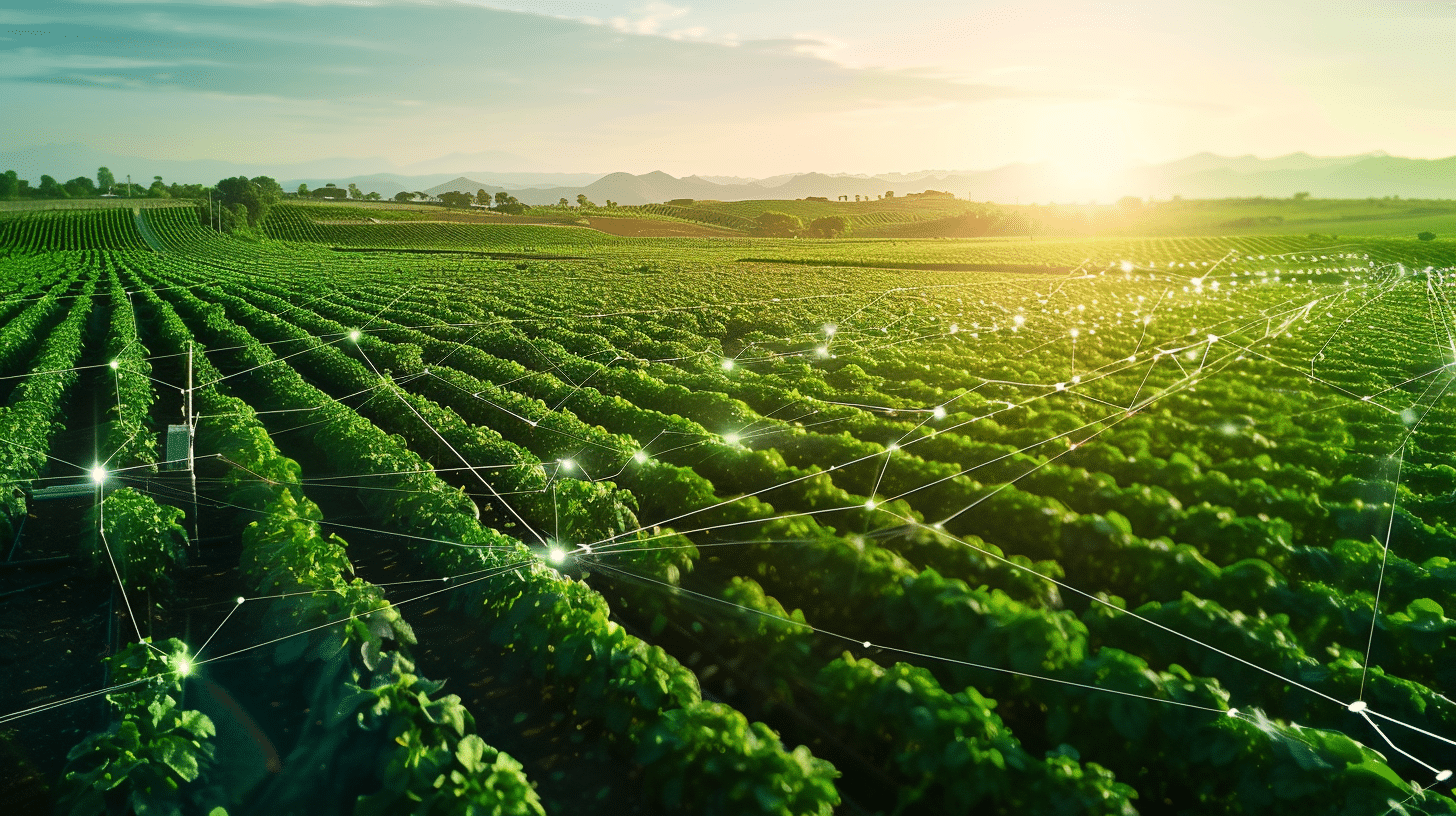
Fertigation injects water-soluble fertilizers into irrigation lines. Smart fertigation systems automate dosing and scheduling so plants receive precise nutrition while water is applied efficiently. The outcome is lower input cost, higher yield stability, and cleaner operations.
If you want to estimate your own farm payback, Haishun can help model CAPEX, OPEX and savings assumptions.
Explore the Smart Fertigation System or contact us.
II. Industry Trends & Significance
The business case for smart fertigation systems is accelerating because farms face increasing pressure to reduce input waste while maintaining yield and quality.
- Precision Agriculture: Decisions guided by sensors and analytics reduce variability and waste.
- Resource Scarcity: Water and fertilizers face cost and availability pressures; efficiency wins.
- Sustainability: Better nutrient use lowers runoff and emissions. See FAO resources for broader context.
- Yield Demands: Higher output with fewer inputs is a competitive necessity.
III. Cost Structure (CAPEX & OPEX)
A complete cost analysis for smart fertigation systems should separate one-time investment (CAPEX) from recurring costs (OPEX). This makes it easier to model payback and optimize total cost of ownership.
Typical CAPEX
- Controller + dosing skid
- Sensors (flow, pressure, EC, pH)
- Filters, valves, injectors, manifolds
- Connectivity (gateway, cabling)
- Installation & commissioning
Typical OPEX
- Fertilizers (reduced via precision dosing)
- Water & energy (lower through optimized schedules)
- Routine maintenance (filters, flushes)
- Software subscription & support
- Labor (reduced via automation & remote control)
| Aspect | Traditional Methods | Smart Fertigation System |
|---|---|---|
| Nutrient Application | Manual, uneven distribution | Automated, precise, crop-specific |
| Water Usage | Inefficient, over- or under-watering | Optimized via data-driven scheduling |
| Labor | Higher manual involvement | Lower—remote monitoring/control |
| Yield Stability | Variable | More consistent; improved quality |
| Tracking & Optimization | Manual logs; delayed insight | Real-time analytics; automated adjustments |
Internal resources:
Smart Fertigation System (Product Page) • Haishun Homepage • Contact
IV. ROI Model & Payback Timeline
The ROI of smart fertigation systems typically comes from three buckets: input savings (fertilizer, water, energy), labor savings (automation & remote operations), and yield uplift (better plant health and quality stability).
Open ROI math (example scenario)
Annual savings = (Fertilizer saved + Water/energy saved + Labor saved) + (Yield gain × farm price)
Payback (months) = (CAPEX ÷ Annual savings) × 12
- Fertilizer saved: 20–50% via precision dosing
- Water saved: 20–40% through optimized irrigation
- Labor saved: fewer field rounds & faster response
- Yield gain: 3–12% depending on crop & baseline
For a more accurate estimate, model each zone separately (crop, soil, water source, pump energy, labor pattern). This helps smart fertigation systems deliver predictable payback rather than “average” results.
V. How Smart Fertigation Systems Drive Savings
Precision Nutrient Delivery
Right rate, right time, right place—reduces waste and raises nutrient use efficiency in smart fertigation systems.
Optimized Water Management
Schedules adapt to crop stage and field signals to cut water stress and pumping cost.
Remote Monitoring & Control
Operate from anywhere; fewer field visits and faster course corrections reduce labor.
Data Analytics & Reporting
Trends and alerts highlight inefficiencies so improvements compound over time.
VI. Comparison: Traditional vs Smart
| Feature | How it Lowers Cost | How it Increases ROI |
|---|---|---|
| Precision Nutrient Delivery | Less fertilizer waste; better uptake | Higher yield & consistent quality |
| Optimized Water Management | Lower water bills; fewer pumping hours | Healthier plants; reduced stress |
| Remote Control | Reduced labor & travel | Faster decisions; minimized downtime |
| Analytics & Reports | Detect leaks, clogging, and over-irrigation early | Continuous optimization compounds savings |
| Integration | Minimal retrofit waste | Faster adoption and payback |
VII. Common Challenges & Mitigations
- Clogging: Use proper filtration + periodic flushes; monitor differential pressure.
- Nutrient imbalance: Calibrate EC/pH; verify with soil/tissue tests.
- Hardware faults: Preventive maintenance; keep critical spares.
- Software gaps: Keep firmware updated; provide operator training.
Well-designed smart fertigation systems reduce risk by logging events, triggering alerts, and standardizing on-farm SOPs.
VIII. Selection Checklist
Open the buyer’s checklist
- Crop & acreage mapping; zone control needs
- Water source & filtration design
- Sensors required (flow, pressure, EC, pH, soil moisture)
- Automation level & remote access
- Scalability & retrofit compatibility
- Support, training, and SLA
- Total cost of ownership & payback target
Want a fast feasibility check for your farm? Haishun can map zones, estimate CAPEX/OPEX, and project payback for smart fertigation systems.
Visit Haishun or contact us via email.
IX. Frequently Asked Questions
How fast do smart fertigation systems pay back?
Many farms reach payback in 12–24 months based on input savings, labor reduction, and yield stability improvements.
Do I need new irrigation lines?
Not always. Most systems retrofit onto existing drip or micro-sprinkler networks with appropriate manifolds and valves.
What if my water quality is poor?
Design filtration for your source, monitor EC/pH, and consider acid dosing to prevent scaling and clogging.
Can the system run without internet?
Yes. Core control runs locally; remote dashboards and alerts require connectivity for full functionality.
How do smart fertigation systems improve yield?
Uniform, timely nutrient delivery reduces stress and variability, improving fruit set, size, and quality consistency.